Most US dividend investors I talk to use TradingView the same way they use it for US stocks—open a chart, slap on a moving average, set a price alert—and then quietly give up the moment they try to do the same thing for a Japanese name. The ticker autocomplete does not behave the way they expect, the screener seems to be missing half the country, and the fundamental tab feels thin. So they go back to whatever they were using before and assume TradingView "doesn't really do Japan."
It does. It just rewards a small amount of setup. This is the setup I have actually built over three months of using TradingView Premium from a Tokyo apartment to track a watchlist of Japanese dividend stocks—the TSE ticker format that makes search behave, the 12-name watchlist I look at every morning, the screener filters that actually find Japanese dividend payers, and the weak-yen chart layout I keep pinned to a second monitor. It is also an honest look at where TradingView is weak for Japan—mostly on fundamentals—and what plan tier is and is not worth the money.
This guide is written from a Japan-based vantage point for US and global investors, with screenshots and tickers you can replicate today. It is educational, not investment advice, and the disclaimer is at the end.
Disclosure: This post contains affiliate links. We may earn a commission at no extra cost to you. See Disclaimer for details.

Why TradingView works for Japanese stocks (and where it falls short)
The first thing to be honest about is what TradingView is for. It is a charting and alerting platform, with a community layer on top, that happens to have global coverage. It is not a fundamentals database. It is not a portfolio tracker built for dividend reinvestment math. And it is not a substitute for reading an IR deck.
For a US investor coming to Japanese stocks, that division of labor matters more than usual. The fundamentals story on a Japanese name often hinges on details that do not exist as a TradingView line item—a recent payout-ratio policy in the IR materials, a quarterly segment mix, a one-off commemorative dividend, a fiscal year ending in December rather than March. If you treat TradingView's screener output as a stock-pick generator the way some people treat US data on it, you will keep getting tripped up by yield numbers that quietly include special dividends.
In my experience, TradingView's fundamentals tab is the weakest part of the platform for non-US markets like Japan—the deeper a name's filings are in Japanese, the thinner the data tab gets. The strength is the chart side, the alerts engine, and the screener as a filtering tool—not as a final answer. That is the lens I use for everything below.
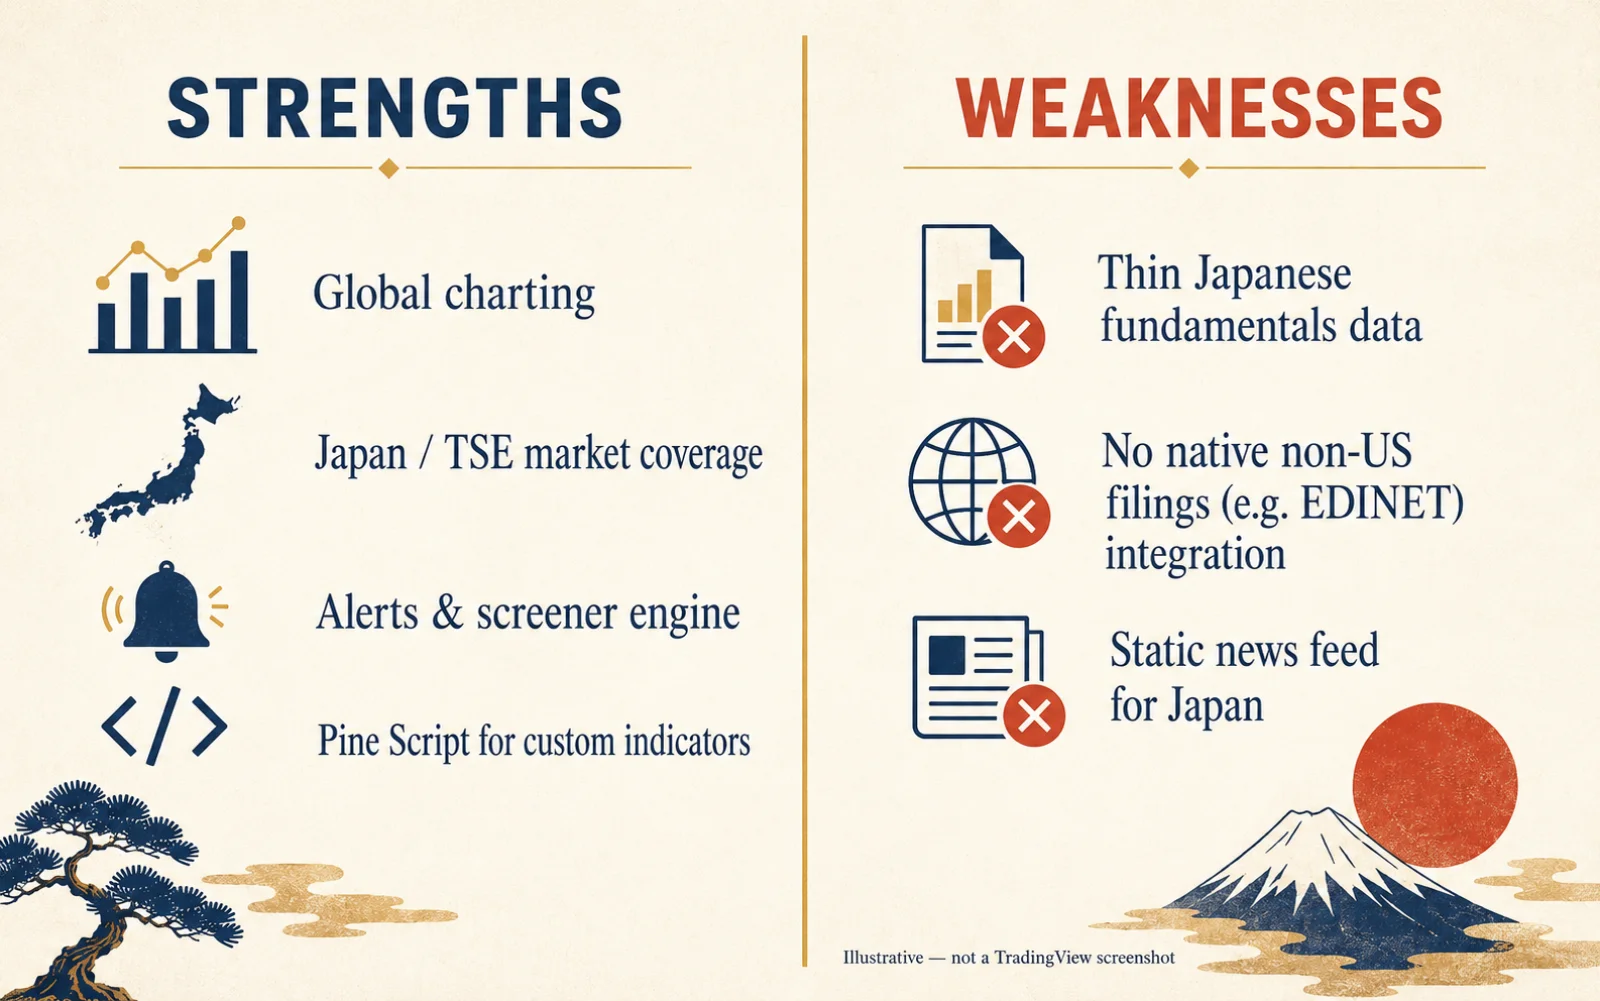
| TradingView | Wisesheets | stockanalysis.com | Simply Wall St | |
|---|---|---|---|---|
| Charting & technicals | Strong (global coverage incl. TSE) | None | Basic | Visual snapshots |
| TSE ticker support | Yes (TSE:XXXX) | Yes (Google Finance backend) | Limited (US ADRs only) | Yes |
| Japanese fundamentals depth | Thin (weakest link) | Spreadsheet-flexible | US-centric | Strong visual summaries |
| Dividend history (Japan) | Headline yield only | Pullable to Sheets | ADR-only | Multi-year charts |
| Alerts & watchlists | Best in class | None | None | None (snapshot only) |
| Best used for | Charting + alerts + screening | Custom data tables | Cross-checking yield/EPS | Visual due diligence |
That is the honest landscape. The rest of this post is what to do inside TradingView once you accept that boundary—a workflow that has, in my experience, made tracking 10–15 Japanese dividend names dramatically less painful than the old "tab-hop between Yahoo Japan, Kabutan, and SBI Securities" routine.
TSE ticker format: how to add Japanese stocks
This is the single most common stumble. Type "Toyota" into TradingView's search and you will get a wall of suggestions—Toyota Industries, Toyota Boshoku, the ADR, the Frankfurt listing, the OTC. The way to cut through it is to use the exchange prefix directly: every TSE-listed stock has a four-digit security code, and TradingView indexes them under the prefix TSE:.
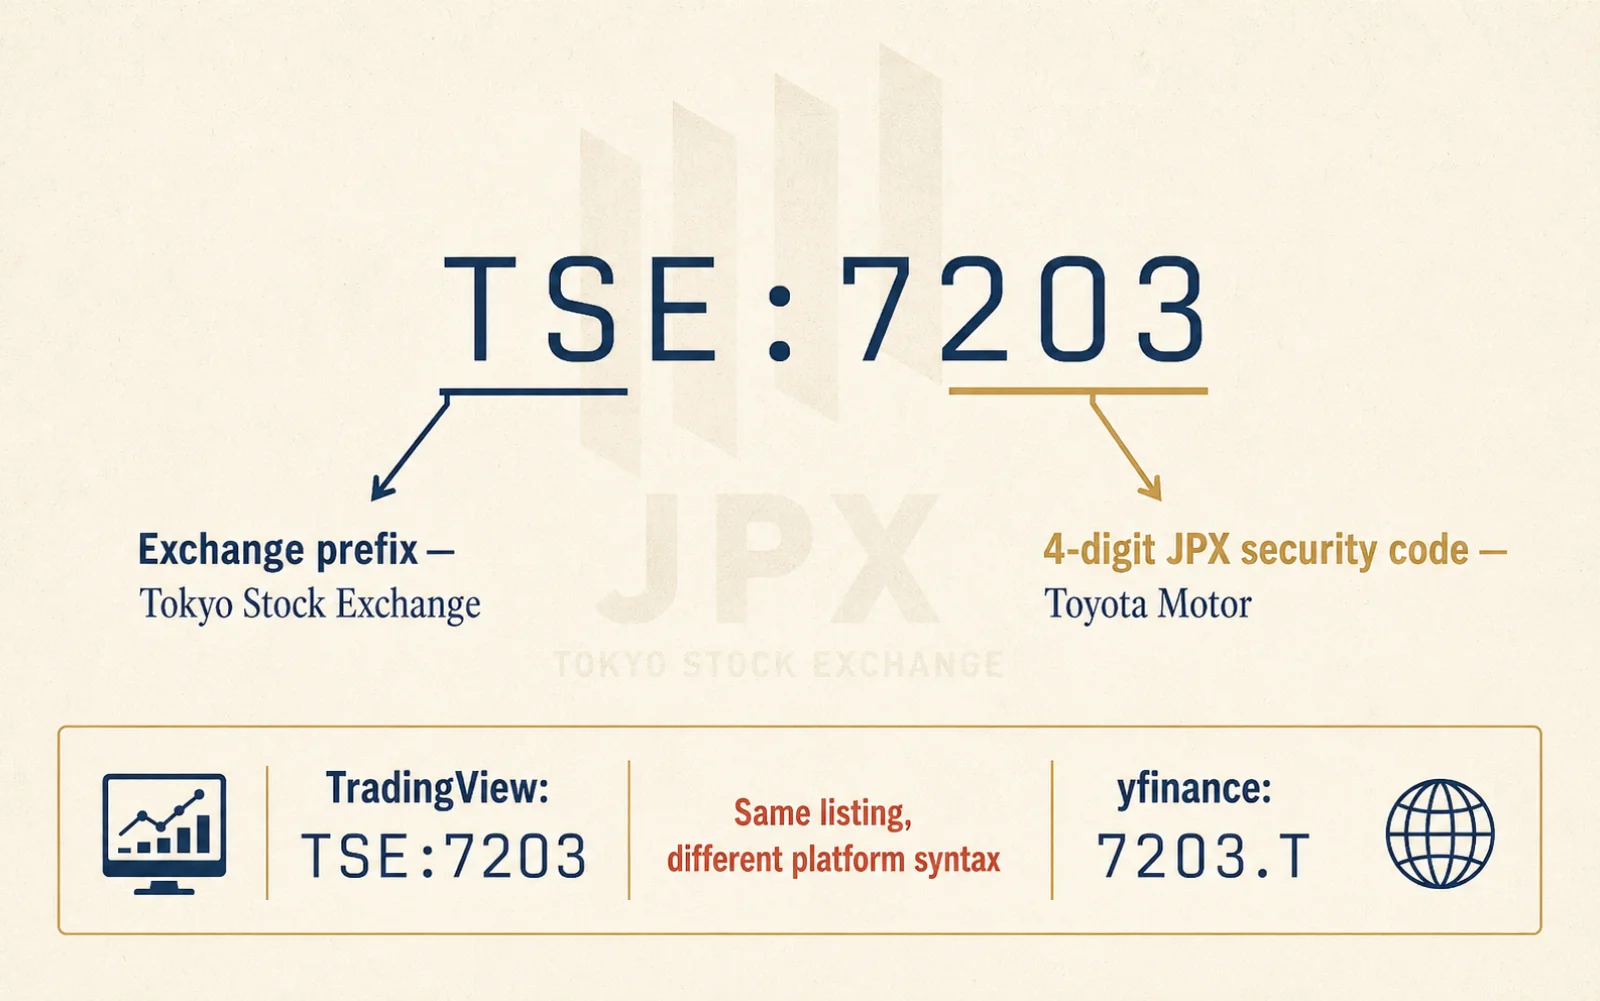
A few examples that anyone reading this blog will recognize:
| Company | TSE code | TradingView symbol |
|---|---|---|
| Toyota Motor | 7203 | TSE:7203 |
| SoftBank Group | 9984 | TSE:9984 |
| Sakata INX | 4633 | TSE:4633 |
| Kamigumi | 9364 | TSE:9364 |
| Mitsubishi Corp | 8058 | TSE:8058 |
| Bridgestone | 5108 | TSE:5108 |
The prefix matters because it disambiguates against ADRs and other listings. Searching for TSE:7203 lands directly on the Tokyo-listed Toyota Motor shares, priced in yen and on Tokyo trading hours. Searching for "TM" lands you on the New York ADR. The two have different prices, different liquidity, and—critically for a dividend investor—different tax treatment. (For the withholding details, our separate Japanese Dividend Tax 2026 Guide covers the 10% treaty rate in depth.)
The Japan Exchange Group itself is the authoritative source for the four-digit codes. If you ever lose the symbol, the JPX listed-company search will give you the canonical TSE code, which you can then paste into TradingView with the TSE: prefix. The same convention applies to J-REITs (often four-digit codes starting with 3xxx) and ETFs (1xxx range, e.g. TSE:1306 for the TOPIX ETF).
A small but important caveat on real-time data: TSE pricing inside TradingView is generally delayed by 15-20 minutes on the free plan, in line with what most consumer platforms get from market-data providers. Real-time TSE data is a paid licensing arrangement between the exchange and data redistributors. For a long-only dividend watcher this delay is irrelevant—dividends do not care about a 15-20 minute lag—but if you ever consider TradingView for active trading of Japanese stocks, you would need to subscribe to the real-time TSE data add-on separately from the platform fee.
My watchlist setup: 12 Japanese dividend stocks I track daily
This is the part where most "best TradingView setup" articles get vague. So let me be concrete. The watchlist I check most mornings is twelve names, deliberately small enough to actually read—not screen.
I have organized it in TradingView into two color-coded groups, using the watchlist's color-coded list dividers. The groups are not sector buckets; they are investment-thesis buckets, which I find more useful than industry tags for portfolio reasoning.
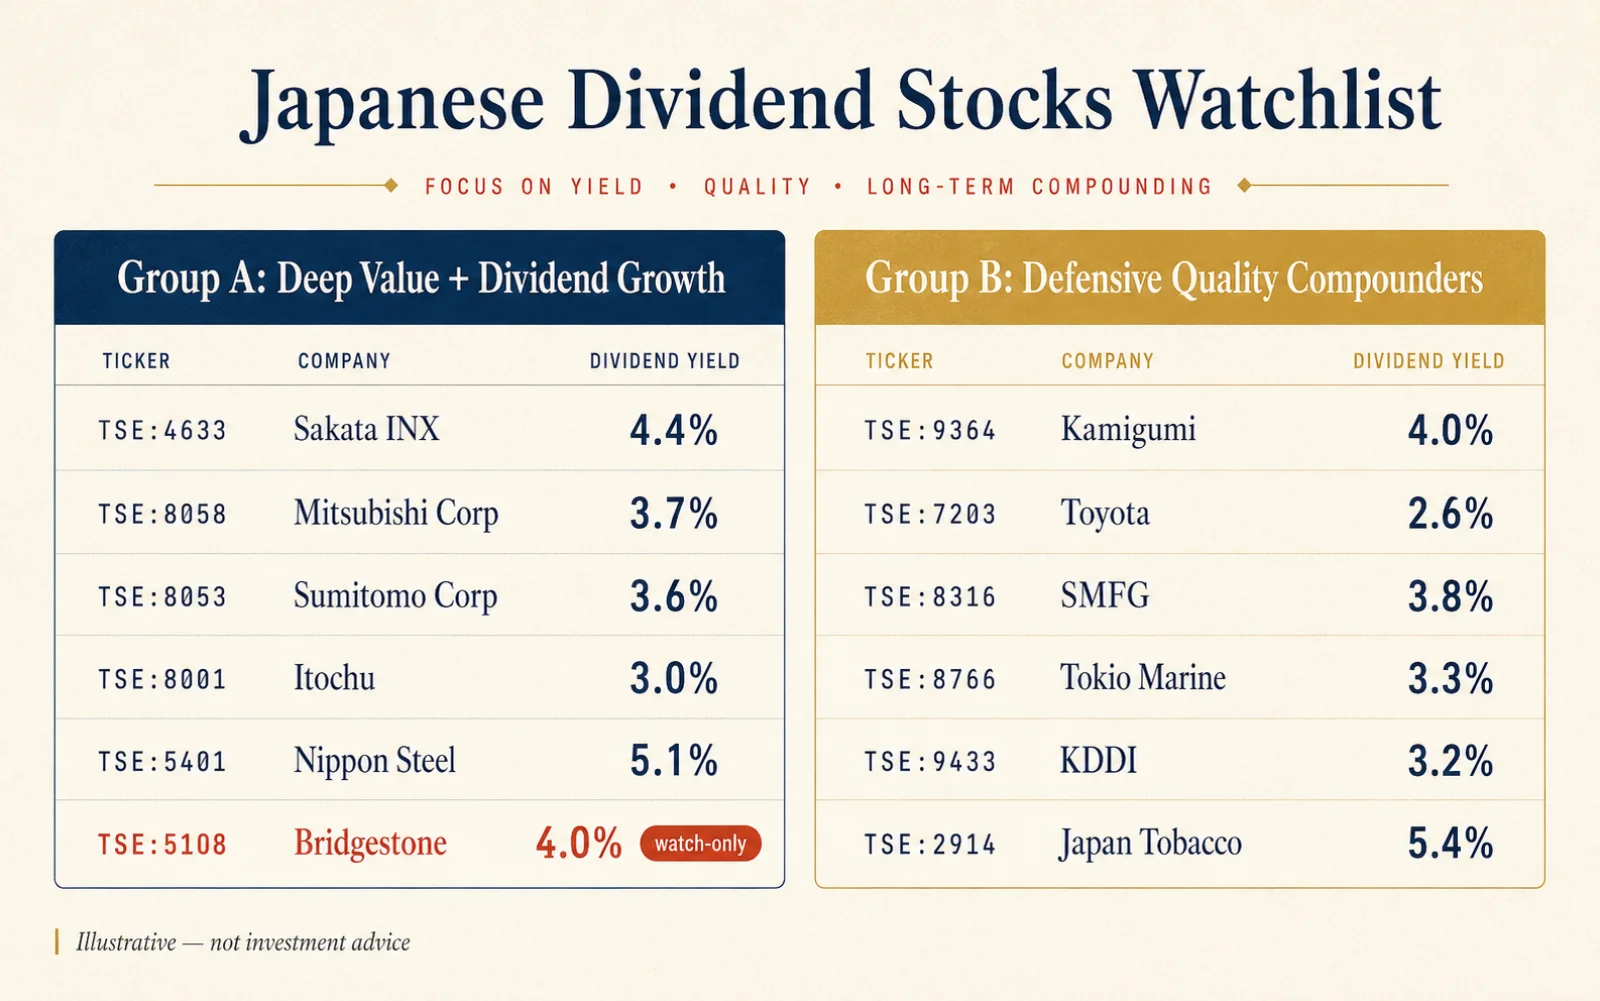
- TSE:4633 — Sakata INX (printing inks)
- TSE:8058 — Mitsubishi Corp (sogo shosha)
- TSE:8053 — Sumitomo Corp
- TSE:8001 — Itochu
- TSE:5401 — Nippon Steel
- TSE:5108 — Bridgestone (watch-only; yield-trap risk)
- TSE:9364 — Kamigumi (port logistics)
- TSE:7203 — Toyota Motor
- TSE:8316 — Sumitomo Mitsui Financial
- TSE:8766 — Tokio Marine
- TSE:9433 — KDDI
- TSE:2914 — Japan Tobacco
A few things about why this list works the way it does:
- Two thesis buckets, not twelve. Looking at six "deep value + dividend growth" names side-by-side—Sakata INX (4633) next to a sogo shosha like Mitsubishi (which is part of the Buffett basket I wrote about in What Warren Buffett's Japan Bet Teaches Value Investors)—makes it obvious which one is moving on a company-specific story and which is moving with a sector. That comparative view is the whole point of a watchlist as opposed to a portfolio screen.
- Watch-only entries are real entries. Bridgestone (5108) sits in Group A as a watch-only name. I do not own it; it was flagged in our May 2026 high-dividend portfolio note as a yield-trap candidate, and tracking it in the same watchlist as the names I do own makes the yield-trap pattern easier to recognize next time.
- Defensive quality compounders look boring on a watchlist—and that is the feature. Kamigumi (detail piece here), Toyota, and KDDI rarely move 3% in a day. The point of Group B is to not react to their daily prices and to focus the eye on Group A's noisier names.
I built this watchlist on a Friday afternoon and have changed exactly one ticker in three months. That stability is, in my experience, the single best signal that a watchlist is correctly sized.
A watchlist that you keep editing every week is not a watchlist; it is a screener output with sentimental attachment.
On watchlist discipline
Screener filters that actually work for Japanese dividend hunting
TradingView's screener is the second feature I use daily, and it is also the feature people most often misuse. The trap is to filter on yield alone—type "dividend yield > 4%" and sort descending—because in Japan that will surface a procession of names where the headline yield includes a one-off commemorative payment, a final-year liquidation, or a payout that has just been cut and is about to fall out of the trailing twelve months.
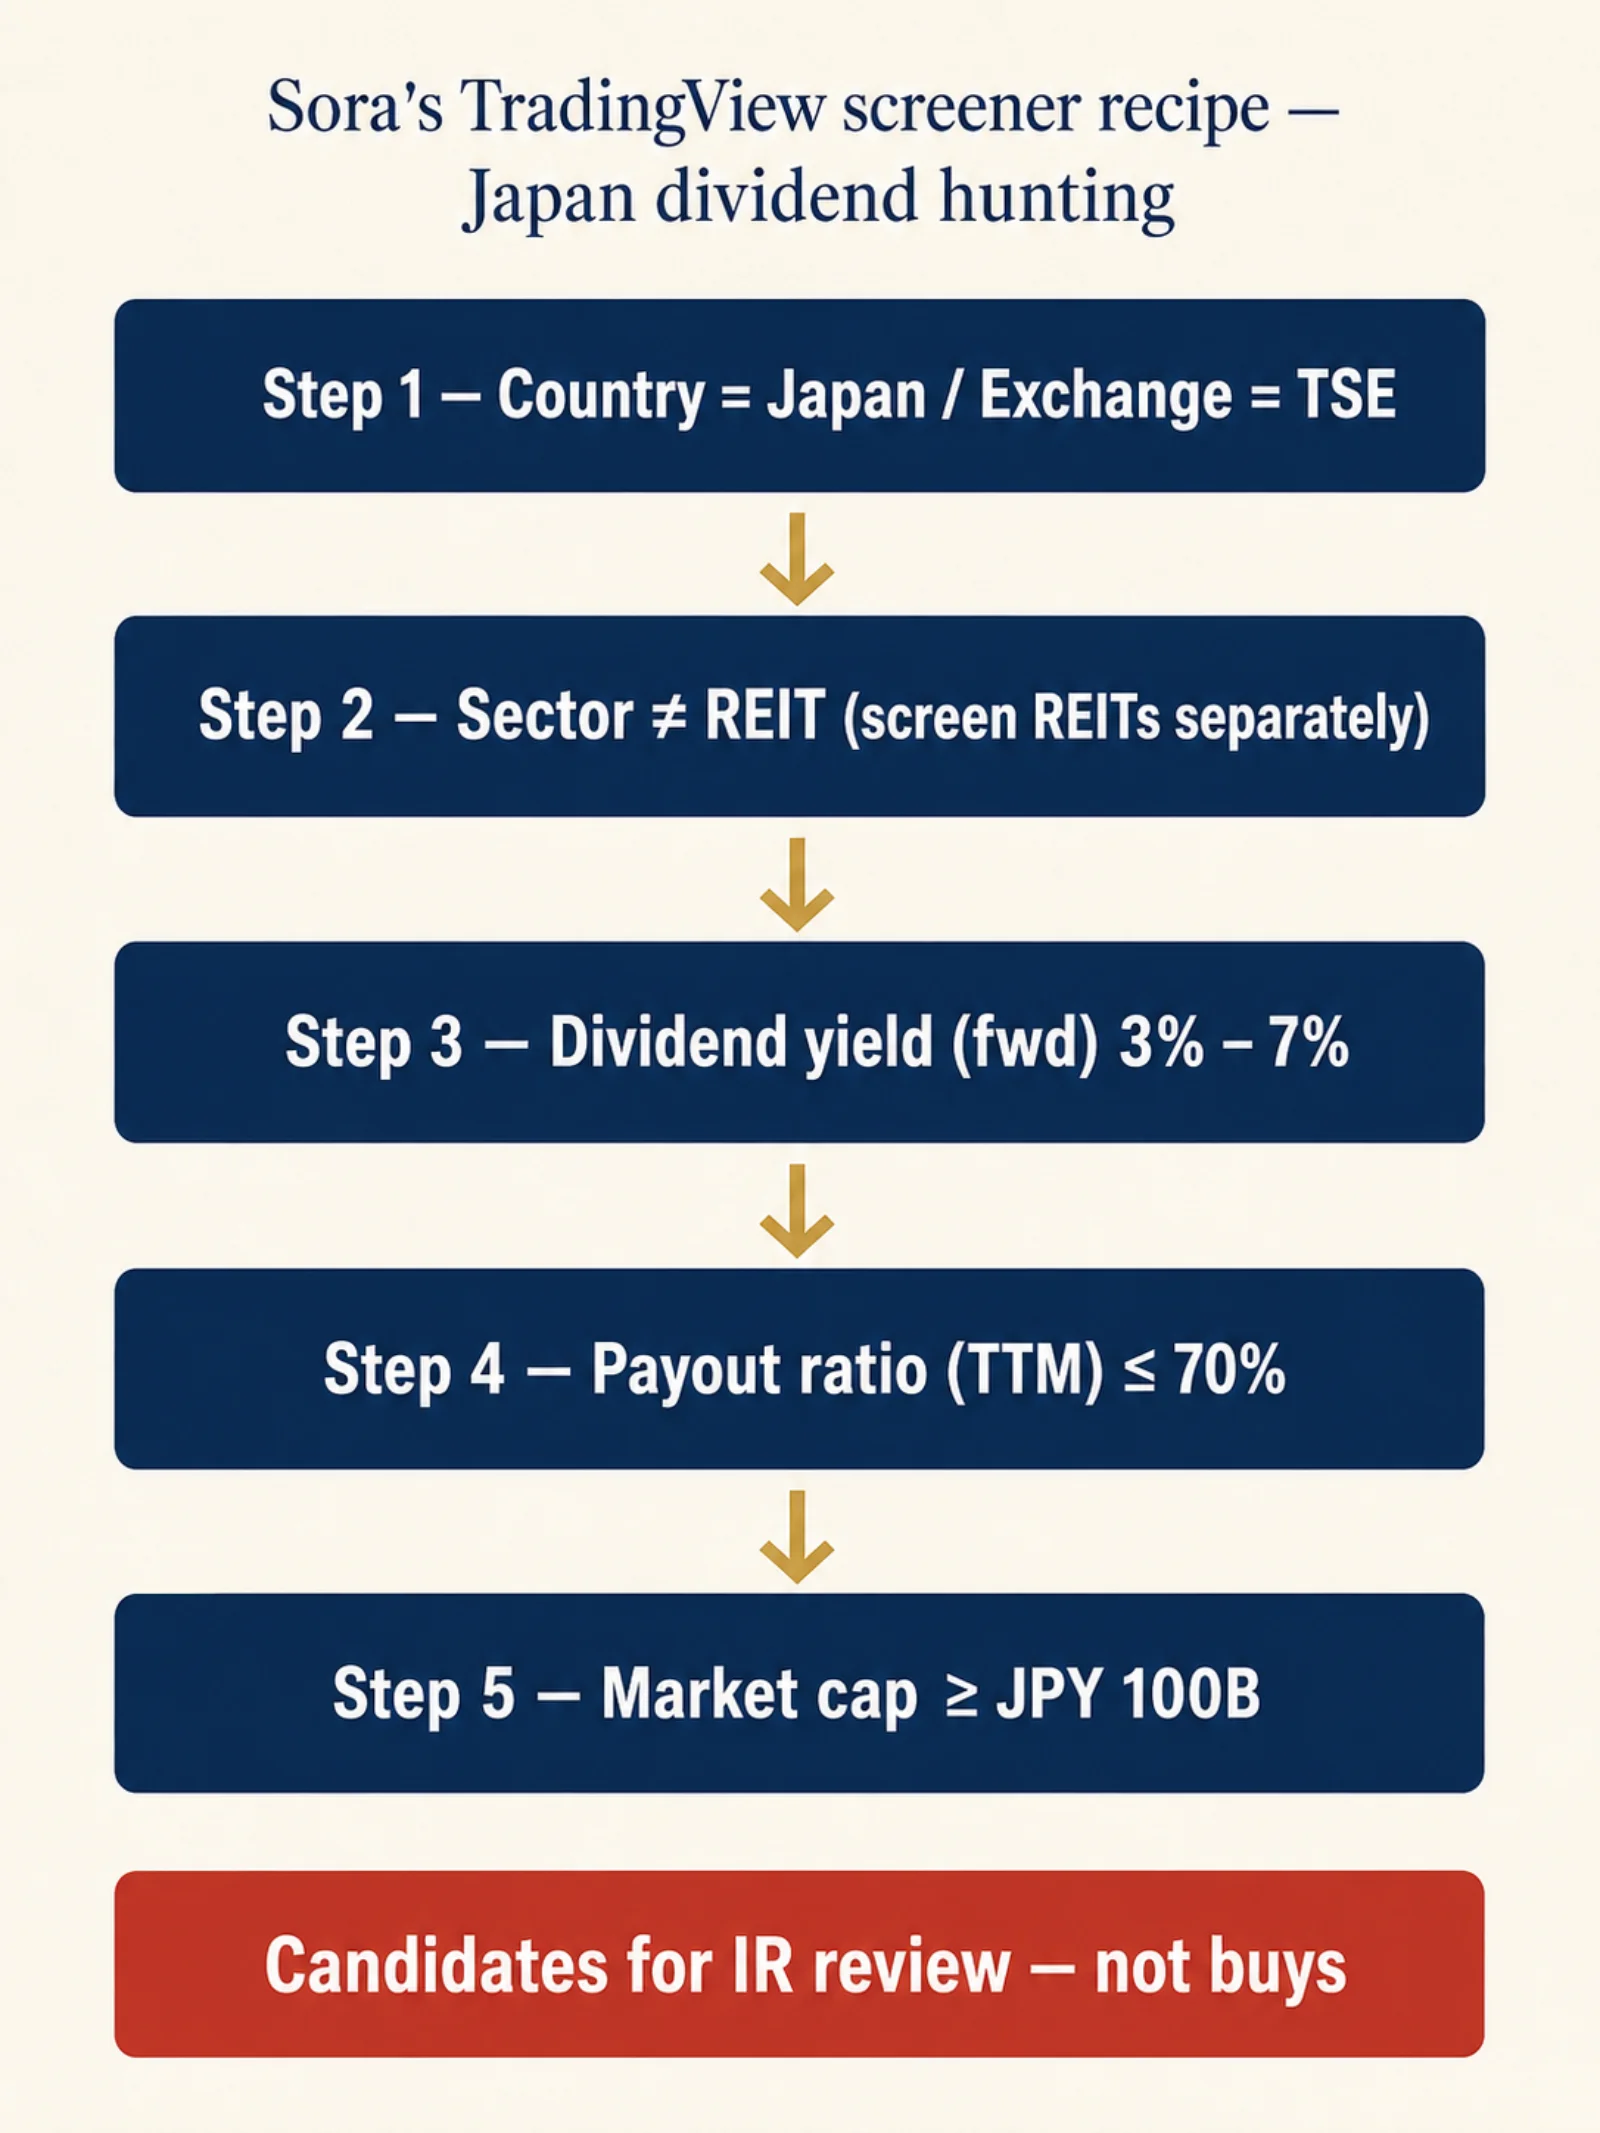
The filter stack I keep saved as "Japan dividend candidates" is:
- Exchange = TSENarrows the universe to Tokyo-listed names from the global default. Without this, you will get cross-listings polluting the results.
- Dividend yield (forward) between 3% and 7%Lower bound filters out non-payers; upper bound throws away yields that are 'high' because the price collapsed—usually a cut is coming.
- Payout ratio (TTM) ≤ 70%The cleanest single filter against unsustainable payouts. Anything above 70% in Japan is either a REIT, a tobacco company, or a name on the edge.
- Market cap ≥ JPY 100BDrops the long tail of tiny names where the yield is real but the float and liquidity are not.
- Sector ≠ REIT (separate screen)J-REITs deserve their own analysis—a different distribution structure and a different tax treatment. I run them as a parallel screen, not a co-mingled one.
A few notes on what I deliberately do not filter on:
- Five-year DPS growth. TradingView's history on Japanese DPS is good but not perfect, especially for names that have had commemorative dividends or stock splits in the period. I check DPS growth manually on the IR site rather than relying on the screener.
- TSE governance-reform compliance. This is a real bull-case overlay for Japanese names trading below book value, and TradingView does not yet expose a clean field for "company has disclosed a capital-cost-conscious-management plan." I tag it manually in my own notes.
- NISA eligibility. Even though this is a US-investor-facing blog, the NISA framework matters for understanding Japanese dividend flows—and the eMAXIS naming trap I covered in the NISA fund-selection trap piece is a reminder that simple-looking screens hide pricing differences worth real money. TradingView will not catch that for you.
The screener also runs a separate J-REIT screen for me—it is one of the few corners of the Japanese market that can be screened on yield alone with reasonable safety, because the distribution structure is more standardized. The TSE REIT Index posted a +15.15% total return over the 12 months to end-April 2026, per JPX's official factsheet for the index. If you are screening Japanese REITs in TradingView, restrict the universe to Industry = REIT and apply the same payout-ratio cap—J-REITs publishing distribution ratios above 100% of net income are sometimes returning capital, not paying from earnings, and the screener will not tell you which is which.
Charting the weak-yen trade: Nikkei × USDJPY × 10Y JGB layout
This is the layout I use most, and the one that took me longest to settle on. Anyone watching Japanese equities for more than a quarter has noticed that the Nikkei does not move only on Japanese fundamentals—it moves on the yen, on Japanese government bond yields, and on whatever the Bank of Japan does or does not signal. Looking at the Nikkei chart in isolation is, in my experience, actively misleading.
The fix is a three-pane TradingView layout that pulls the three series I care about onto one screen.
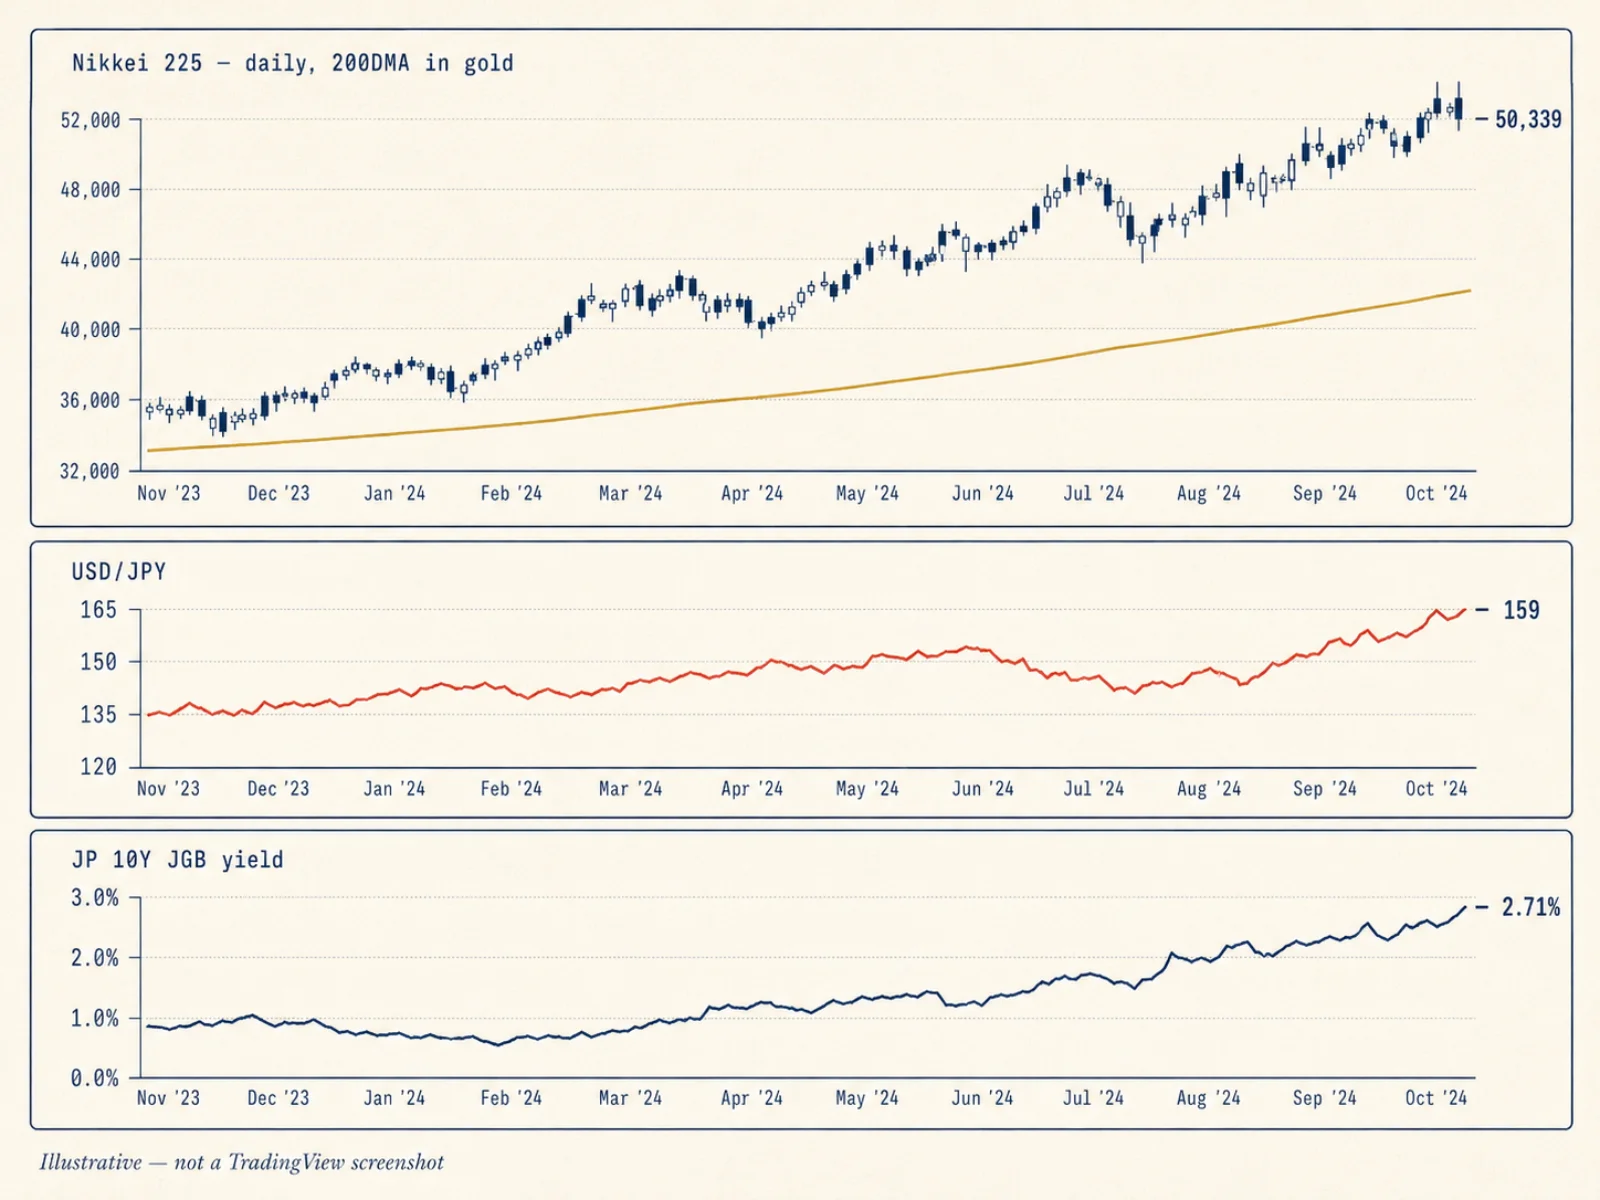
- Pane 1 (main): TVC:NI225 — Nikkei 225 indexDaily candles with a 200-day simple moving average overlaid. The 200DMA is the simplest 'regime filter' for a long-only allocator—below it is risk-off, above it is risk-on, and the Nikkei broke decisively above its 200DMA in late 2024 and stayed there.
- Horizontal line at 50,300Drawn at the rough 2025 year-end closing level—the index finished 2025 near 50,339—because that level has become a psychological reference point for buyers and sellers and shows up clearly in subsequent price action.
- Pane 2: FX:USDJPY — US dollar / Japanese yenTracks roughly 159 in late May 2026, near the level that drew Tokyo intervention in spring. A weaker yen is, all else equal, supportive of Nikkei multinationals but a drag on dollar-translated returns.
- Pane 3: TVC:JP10Y — Japan 10-year government bond yieldTrading near 2.71% in late May 2026, multi-decade highs, after the Bank of Japan held its policy rate at 0.75% in April. Rising long-end yields tighten the discount-rate side of the Japan equity-risk premium.
A few things I have learned from staring at this layout daily:
The 200-day moving average is genuinely useful for Japan. The Nikkei's break above its 200DMA in late 2024 was one of the cleanest "regime" signals you will see, and it has held through the entire move into all-time-high territory. When US markets had their March 2026 correction—the Nasdaq saw a high-single-digit pullback—the Nikkei dipped to its 200DMA, held, and resumed higher. As a regime filter for a long-only dividend allocator, "is the index above or below its 200DMA?" is a far better single question than "is the index at an all-time high?"—because the latter is a level question and the former is a trend question. The all-time-high context I wrote up in Nikkei 225 just made a new all-time high is much more useful with the 200DMA overlay attached.
USD/JPY at 159 is not the same story as USD/JPY at 145. A US investor in Japanese stocks is implicitly long the yen via the equity exposure. When the yen weakens from 145 to 159, the dollar value of the same Japanese dividend falls by roughly 9.6%, even if the stock did nothing in yen terms. The point of having USD/JPY in pane 2 is not to trade it—it is to make the dollar drag visible at the same time as the yen-denominated chart, so the two are never separated mentally.
Long-end JGB yields are the quiet leg. At around 2.71% in late May 2026 (after briefly peaking above 2.8% mid-month, a near-three-decade high), the 10-year JGB yield is higher than it has been in roughly 30 years, and that compression of the Japan equity risk premium is the single biggest macro headwind to the Nikkei's price-to-earnings multiple. Most equity-only investors I know simply do not look at it. Putting it in pane 3 forces the question into the daily glance.
This is a free layout—no Premium features required—and I would argue it is the single most useful saved chart for a US investor in Japanese stocks who wants to understand what they are actually exposed to. The Federal Reserve, the Bank of Japan, and the yen will do more to the dollar value of your Japanese dividends in any given year than any individual company's earnings beat or miss.
Is TradingView Premium worth it for Japanese stocks?
This is the question I get asked most, including by friends who follow this blog and want to know whether to take a free TradingView account and just live with the limits. The honest answer depends on how many Japanese names you watch and how serious you are about alerts. Here is the actual feature math.
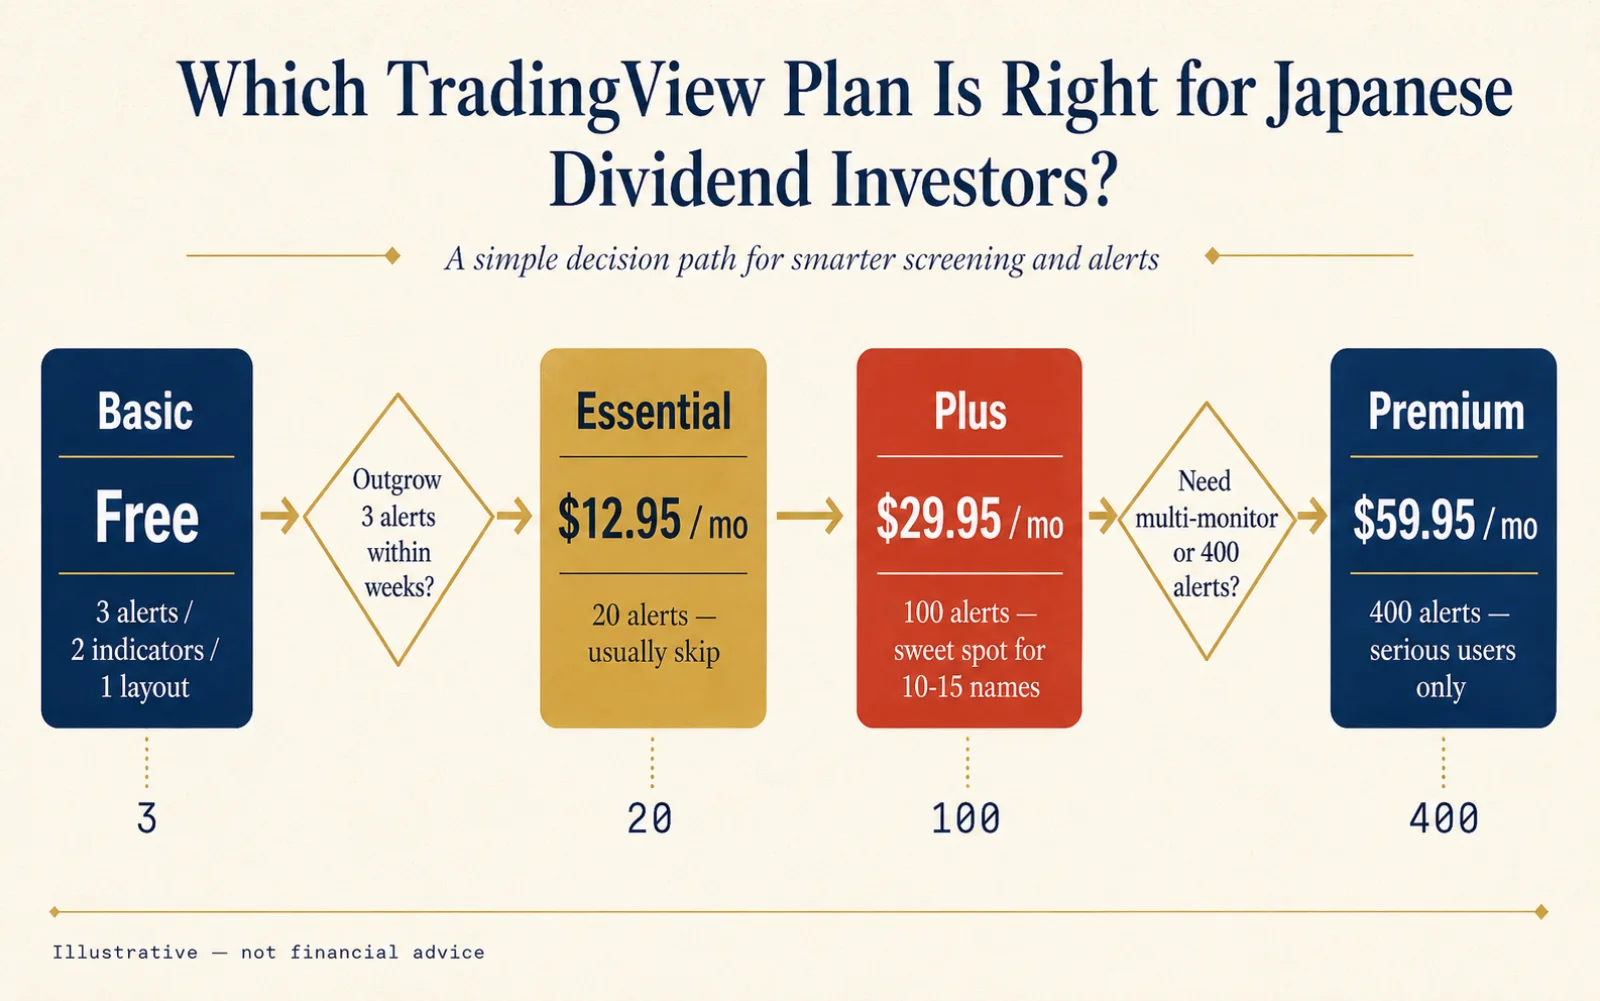
| Feature | Basic (Free) | Essential | Plus | Premium |
|---|---|---|---|---|
| Monthly price (annual billing) | $0 | $12.95 | $29.95 | $59.95 |
| Active price alerts | 3 | 20 | 100 | 400 |
| Indicators per chart | 2 | 5 | 10 | 25 |
| Charts per layout | 1 | 2 | 4 | 8 |
| Saved chart layouts | 1 | 5 | 10 | 10 |
| Historical bars on chart | 5K | 10K | 10K | 20K |
| Watchlists (official spec) | 1 | 1 | 1 | 1 |
The features I actually use on Premium, after three months, are concrete:
- 400 active price alerts. This is the single feature that pushed me past the free tier. With a 12-name watchlist, I want at least two alerts per name—one for "yield is interesting again" (a price floor) and one for "fundamental thesis is broken or fully priced" (a ceiling)—plus alerts on the macro pane (USD/JPY 160, JP10Y above 3.0%, Nikkei 200DMA test). Three alerts on Basic does not get me through one stock, let alone a watchlist.
- Multi-chart layouts. Having the Nikkei × USDJPY × JGB layout open as one saved screen, and the per-name chart for whatever I am writing about as another, is worth the price of Plus or Premium on its own. On Free, you reload one chart at a time.
- 25 indicators per chart. I do not personally use 25, but I do regularly run 5–7 (200DMA, 50DMA, RSI, dividend-adjusted overlays, volume), which puts me past the Free and Essential limits.
The features I do not use enough to justify Premium over Plus:
- Saved chart layouts. Both Plus and Premium cap saved chart layouts at 10 in the official spec, which is plenty—I currently use nine. Premium's real edge over Plus is multi-monitor support and the alert headroom, not layout count.
- Server-side bar replay. I do not backtest discretionary Japanese stock decisions on TradingView; I read IR materials and look at multi-year yield charts.
- Multiple device sessions. Genuinely useful, but only barely.
If you are starting from zero and watching 5 or fewer Japanese names, Basic (Free) is probably enough—you will run out of alert slots, but you can rebuild them. If you are running a watchlist of 10+ Japanese names and want alerts on each, Plus at $29.95/month is the sweet spot. Premium earns its keep if you want the 400-alert headroom and multi-monitor layouts to run several thesis-driven views side by side—which is where I have landed.
Try TradingView free† — start on the free plan and upgrade only when you genuinely run out of alerts. That has been my honest recommendation for anyone moving from a US-only watchlist into Japanese dividend stocks.
The companion question—"what about the rest of the toolkit?"—I am writing up separately, including portfolio tracking, IR-reading workflows, and the Japan-specific things TradingView does not do. That Best Tools to Research Japanese Stocks piece will appear in this series next; the watchlist setup above is the chart-and-alerts leg of that larger stack.
Frequently asked questions
- What is the TradingView symbol format for Japanese stocks?
- Use the prefix TSE: followed by the four-digit Tokyo Stock Exchange security code. Examples: TSE:7203 for Toyota Motor, TSE:9984 for SoftBank Group, TSE:4633 for Sakata INX, TSE:9364 for Kamigumi. The prefix disambiguates the Tokyo-listed shares from US ADRs and other cross-listings, and Japan Exchange Group's listed-company search is the authoritative source for the four-digit code if you cannot find one.
- Does TradingView have real-time Japanese stock data?
- TSE pricing on TradingView is generally delayed by 15-20 minutes on consumer plans. Real-time TSE market data is a separately licensed product through the Japan Exchange Group, and TradingView offers it as a paid add-on rather than bundling it in. For a long-only dividend investor watching daily closes the 15-20 minute delay is irrelevant; for active trading of Japanese stocks you would need the real-time add-on.
- Is TradingView Free enough for tracking Japanese dividend stocks?
- If you watch 5 or fewer Japanese names and are content with daily glance-and-go reviews, the free Basic plan covers charting, the screener, and 3 active price alerts. The free tier becomes restrictive once you want more than 2 indicators on a chart, more than one saved layout, or alerts on more than a handful of names. Many readers tracking 10+ Japanese dividend names can outgrow Basic within weeks.
- Which TradingView plan is best for Japanese dividend investors?
- Plus at $29.95/month (annual billing) is the practical sweet spot for someone running a 10-15-name Japanese dividend watchlist: 100 active alerts, 10 indicators per chart, 4 charts per layout, 10 saved layouts. Premium at $59.95/month is worth it only if you want 400 alerts across multiple thesis watchlists and the multi-monitor layouts—saved layout count is capped at 10 on both Plus and Premium per TradingView's official spec. Essential at $12.95 still feels too constrained at 20 alerts.
- Can I use TradingView for Japanese fundamentals?
- Only as a starting filter. TradingView's fundamentals tab is the platform's weakest link for non-US markets, and Japan is where the gap is widest because most disclosures live in Japanese-language IR PDFs. Pair TradingView's screener output with the company's English IR site, JPX disclosures, and a fundamentals tool that handles Japan well (Wisesheets, stockanalysis.com for the listed names that exist on it, or Simply Wall St for visual due-diligence summaries).
Bottom line
For a US dividend investor venturing into Japan, TradingView earns its place as the charting-and-alerts layer of the toolkit—not as the whole stack. The TSE ticker format is easier than it looks once you know to type the TSE: prefix, the screener handles a basic dividend-candidate stack as long as you respect what it can and cannot see, and the three-pane weak-yen layout (Nikkei + USD/JPY + JP10Y) is, in my experience, the single most useful saved chart for understanding what owning Japanese stocks actually exposes you to.
The honest limit is on fundamentals. TradingView's Japan fundamentals are thin, the screener will not catch payout-policy nuance or governance-reform tagging, and yields that look "high" on a screen often have a one-off dividend or a recent price drop hiding inside them. That is fine—it just means you read the IR sites alongside, the way you would read 10-Ks alongside a US chart.
If you are starting today and want a recommendation: open a free TradingView account, paste the dozen tickers from the watchlist above, build the weak-yen layout, and only upgrade to Plus when you bump into the alert ceiling. That is the path I would walk a friend through, and it is the order this guide is built for.
Disclaimer: This article is educational and does not constitute investment advice. Tools mentioned are described from the author's personal experience and may not suit every investor. Subscription prices and feature limits cited reflect TradingView's published pricing as of writing and may change. This post contains TradingView affiliate links (marked with †); we may earn a commission at no extra cost to you. This does not influence our editorial recommendations. See the platform's pricing page for current terms.
- TradingView — Pricing (verified May 2026)
- TradingView — Toyota Motor (TSE:7203) canonical symbol page
- TradingView — SoftBank Group (TSE:9984) canonical symbol page
- TradingView — Japanese Stock Market overview
- TradingView — Partner Program rules (commission, disclosure)
- Japan Exchange Group (JPX) — Listed company information (English)
- Japan Exchange Group — Real-time TSE market data (paid information services)
- Bank of Japan — Foreign exchange rates (daily)
- JPX — TSE REIT Index (constituents and index data)
- JPX — Tokyo Stock Exchange REIT Index factsheet (Apr 30, 2026 — total-return performance)